
Executive Summary
PAHs were first shown to cause cancer in the 1930’s. Since then scientists have been proclaiming that PAHs from smoke and burning fossil fuels will cause cancer, but to little avail.
Consider cigarette smoking: With the ten to twelve year delay from exposure to PAHs to the development of cancer, and with the industry suppressing the science, it has taken many years to convince governments that PAHs in cigarette smoke were causing cancer.
Most governments now have restrictions on human-made PAH emissions, but these need to be tightened and enforced. Unconventional gas mining has been banned in several European countries due to public protest over emissions causing health issues. In other countries (such as Australia and USA) the first cases of cancer, from gas mining PAH emissions, are occurring now.
When PAHs enter our bodies by breathing in smoke, they can cause cancer in organs other than the lungs, for example brain, breast, gastric, cervical and oesophagial cancer. Overall PAHs could be causing over 6 million new cancer cases each year (at least 30% of cancers).
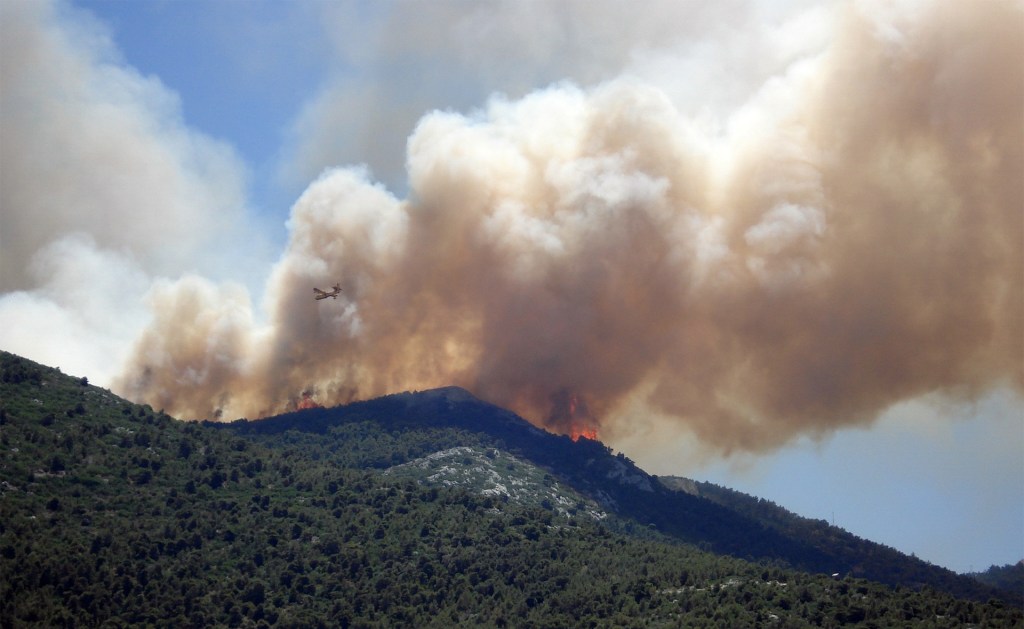
Wildfire smoke is fast becoming the main source of PAHs in our daily lives. PAHs that cause cancer. The prospect of wildfire smoke causing cancer is increasing as worldwide wildfires increase. The catchcry “Climate change causes cancer” should be publicised to support immediate action against climate change. We need to act now.
The Source – Where do PAHs come from?
LINK 1 PAHs are part of everyday living
After reviewing concentrations of PAHs measured in air, water, and soil, Menzie et al (1992) concluded “Because PAHs are ubiquitous, humans are exposed to PAHs as part of everyday living”. Hussein et al (2016) and Berthiaume et al (2021) have reviewed the sources, transportation and fate of PAHs in our environment. Specific sources of PAHs are given below.
PAHs in cigarette smoke
“Nearly 4800 components have been identified in tobacco smoke and among these are over 500 PAHs either completely or partially identified” Rodgman et al 2006. Total PAHs are at a level of 5.386 ug/cigarette, mainly smaller PAHs, with the larger more carcinogenic PAHs at lower but still significant levels (Tetracyclic 7.9%, Pentacyclic 1.3%, and Hexacyclic 0.3 %; see table 5). See also Vu et al 2015.
PAHs in cooked and barbequed food
Saito et al (2014) measured the concentration and particle size distribution of 19 major polycyclic aromatic hydrocarbons (PAHs) emitted by thermal cooking of a range of foods. “The PAHs in the oil mist emitted when the food was grilled were collected according to particle size range and analysed by GC/MS. Much higher concentrations of PAHs were detected in the oil mist emitted by grilled pork, trout, and beef samples, which were rich in fat.”
PAHs are formed when meat is cooked using high-temperature methods, such as grilling directly over an open flame. Lee et al (2016) investigated the effects of grilling procedures on the level of PAHs in grilled meat. “The most important factor contributing to the production of PAHs in grilling was smoke resulting from incomplete combustion of fat dripped onto the fire. The sums of 4 PAHs were reduced 48-89% with dripping removed and 41-74% with the smoke removal treatment in grilled pork and beef meats than conventional grilling.“
Grilling workers are exposed to PAHs when BBQing meat. Olivera et al (2020) found that “levels of total OHPAHs (∑OHPAHs) were significantly increased (about nine times; p ≤ 0.001) during working comparatively with nonworking days. Additionally, 1-hydroxypyrene levels were higher than the benchmark, 0.5 µmol/mol creatinine, in 5% of exposed workers. Moreover, 3-hydroxybenzo(a)pyrene, biomarker of exposure to carcinogenic PAHs, was detected in 13% of exposed workers.”
Duedahl-Olesen et al (2021) have reviewed the formation and mitigation of PAHs in barbecued meat. “Overall, mitigation of carcinogenic PAHs from barbecuing includes removal of visual charring, reducing fat pyrolysis by minimizing dripping from the meat onto the heat source, the use of acidic marinades or choosing leaner cuts of meat.”
PAHs emitted by domestic woodfire cooking and heating
A Swedish study, Gustafson et al (2008), measured PAH levels in houses with or without wood-burning appliances. “Twenty-four hour indoor levels of anthracene, benzo(ghi)fluoranthene, cyclopenta(cd)pyrene, benz(a)anthracene, chrysene/triphenylene, benzo(a)pyrene (BaP), indeno(1,2,3-cd)pyrene, benzo(ghi)perylene, and coronene were significantly (about 3- to 5-fold) higher in homes with, compared with homes without, wood-burning appliances.”
PAHs in fossil fuels
Coal consists of a complex mixture of organic chemicals. PAHs solubilised from coal samples ranged from 1.21 to 28.6 mg/kg, and this did not include compounds 4 rings or larger. Zhao et al (2000). Amounts of US EPA specified PAHs extracted from coals in this study range from 0.28 to 6.38 mg/kg. Less than one quarter have been listed as possible carcinogens, the rest remain unstudied.
NRC (US) Committee on Pyrene and Selected Analogues. (1983) has compiled tables of PAH constituents of fossil fuels, and those measured in air near a range of mining and industrial processes.
Coal tar is produced when coal is carbonised to make coke or gasified to make coal gas. It contains many of the PAHs from coal and is listed by IARC (2012) as a Group 1 mixture, carcinogenic to humans, based on sufficient evidence of human and animal carcinogenicity.
PAHs in diesel fuel and emissions
de Souza and Corrêa (2016) analysed PAHs in diesel fuel, exhaust, and lubricant oil. They found values of up to 16.15g/l in diesel fuel. “The ratio between the PAHs emission factors in exhaust (ug/L diesel) and their respective concentrations in diesel fuel (ug/L) ranged from 0.01 ±0.02 to 0.05 ± 0.029, depending on the PAH.” This means that PAH levels in exhaust are not negligible and will depend on the levels of PAHs in the diesel fuel used.
LINK 2 PAHs in Air
The global total annual atmospheric emission of 16 PAHs in 2007 was 504 Gg (331-818 Gg, as interquartile range), with residential/commercial biomass burning (60.5%), open-field biomass burning (agricultural waste burning, deforestation, and wildfire, 13.6%), and petroleum consumption by on-road motor vehicles (12.8%) as the major sources. Shen et al (2013). Wildfires have more recently come to the fore: Berthiaume et al (2021), “forest fires continue to dominate PAC (PAH) emissions in Canada, however there is uncertainty in these estimates. Though forest fire data show a steady average in the total annual area burned historically, an upward trend has developed recently. Non-industrial sources (home firewood burning, mobile sources) are estimated to be the second largest contributor (∼6-8 times lower than forest fires) and show moderate decreases (25%-65%) in the last decades. Industrial point sources (aluminum production, iron/steel manufacturing) are yet a smaller contributor and have seen considerable reductions (90% +) in recent decades. Fugitive emissions from other industrial sources (e.g. disposals by the non-conventional oil extraction and wastewater sectors, respectively) remain a gap in our understanding of total PAC emissions in Canada. Emerging concerns about previously unrecognized sources such as coal tar-sealed pavement run-off, climate change are discussed elsewhere.”
PAHs emitted in coal mining.
The PAHs found in respirable coal-dust samples were identified as phenanthrene, pyrene, benzo[ghi]fluoranthene, chrysene, perylene, benzoperylene, benzochrysene, and dibenzoperylene. These compounds were more common in coal dust in the mine than in dust from other locations. NRC (US) Committee on Pyrene and Selected Analogues (1983).
For example Shultz (1972) reported finding 13 PAHs in the respirable fraction of coal mine dusts.
PAHs emitted in unconventional gas mining and flaring.
Santos and Maher (2012) have measured some of the highest levels of methane in the atmosphere in CSG mining areas in Queensland. This was consistent with fugitive gas emissions. Whenever wells leak, other chemicals (including PAHs) will be leaking along with methane.
Strosher (1996) identified a range of PAHs in the emissions from flared produced gas, with up to 300 mg/m/sup 3/ for the 16 EPA PAHs. He went on to analyse flaring of solution gas at oil-field battery sites. “Benzene, styrene, ethynyl benzene, ethynyl-methyl benzenes, toluene, xylenes, acenaphthalene, biphenyl, and fluorene were, in most cases, the most abundant compounds found in any of the emissions examined in the field flare testing.”
LINK 3 PAHs in Water
The World Health Organization (1998) has reviewed PAHs in drinking water and their effects on health. PAHs found in drinking water were attributed to coal tar being used to line water pipes. High PAH levels are now being found in freshwater streams and lakes, pointing to anthropogenic sources. “In aquatic environments, the PAH concentrations range widely from 0.03 ng/L (seawater; Southeastern Japan Sea, Japan) to 8,310,000 ng/L (Domestic Wastewater Treatment Plant, Siloam, South Africa)” Mojiri et al (2019).
Adenijiet al (2018) reviewed the sources and toxicity of PAHs, their common analytical methods of determination in the water and sediment samples, and also their global trend of distribution. They have since found individual PAH levels in water and sediment samples of the Buffalo River Estuary, South Africa ranged from not detected (ND) to 24.91 μg/L and ND to 7792 μg/kg, respectively.“ Adeniji et al (2019).
In wildfires, “PAHs could be mobilized from these (ash) matrices over the first year after the fire, possibly leading to aquatic contamination. This finding suggests wildfires as a diffuse source of PAH contamination to freshwater systems, which need to be considering in future monitoring/management programs on the environmental impact of wildfires.” Campos et al (2019).
Chlorination of drinking water can produce chloro-derivatives of PAHs that are even more potent carcinogens, adding to this health risk. McDonald et al (2005).
LINK 4 Fracking
Liberation of PAHs by Unconventional Gas Mining.
Unconventional gas mining solubilises large quantities of chemicals from coal (production water can range between 0.1 megalitres per day (ML/d) and 0.8 ML/d.48 ), and uses large amounts of drilling and fracking chemicals typically 18.500 kg (Lloyd-Smith and Sengen, 2011). “Geogenic contaminants mobilised from the coal seams during fracking may add to the mixture of chemicals with the potential to affect both ground and surface water quality” (Batley et al 2012). Orem et al (2007) identified a wide range of phenols, biphenyls, heterocyclic compounds, aromatic amines and aliphatic compounds, typical of those found in coal, in produced water from Wyoming CSG wells. Total PAHs were measured at levels of 23µg/l. Individual PAHs ranged from 0.01 to 18 µg/l.
Fracking chemicals compared to solubilized coal chemicals.
Fracking chemicals include known human carcinogens eg. benzene, and potentially more potent carcinogens as impurities (Lloyd-Smith and Sengen, 2011). Produced water samples from coalbed natural gas (CBNG) wells in the Powder River Basin, WY, sampled in 2001 and 2002 by Orem et al 2007, contained levels of 0.16µg/l for benzene and 5.4ng/l for the PAH, benzo(a)pyrene. Benzene is used as a fracking fluid (United States Environmental Protection Agency, 2015) but not PAHs. PAHs come from solubilised coal, shale, or oil, brought up from deep underground. They could also come from vehicle exhausts on site, but not at these levels.
Using the levels measured in produce water by Orem et al (2007):
Benzene 0.16µg/l
Benzo(a)pyrene 0.0054µg/l,
the concentration of benzene is 30 times higher than the PAH, Benzyo(a)pyrene.
Using the the relative potencies in causing cancer:
Benzene 0.035/ mg/kg/day (United States Environmental Protection Agency, 2017) and Benzo(a)pyrene 11.5 mg/kg/day (Schneider et al, 2002), the relative cancer potencies are (BaP:Benzene 300:1). Taking into account the concentrations in the produce water (1:30), the cancer risk from BaP in this produce water would be ten times that of the benzene.
Considering total PAHs, their concentration would be similar to benzene in this produce water sample, but the cancer risk for PAH mixtures could be up to 14,500 times higher than benzene (World Health Organization, 2010). Produce water is reused, increasing the PAH content (from solubilised coal or shale) each time it is used. Benzene is no longer used in fracking fluids due to its toxicity. So the cancer risks from PAHs released by solubulising coal are likely to be far greater than the risks from fracking chemicals.
See also PAHs emitted in unconventional gas mining and flaring above.
LINK 5 PAHs are worldwide and underestimated
“PAHs are ubiquitous in the environment and are carcinogenic compounds and tend to accumulate in food chains due to their low bioavailability and poor biodegradability”
Wang et al (2018).
Yang et al (2021) have summarised personal exposure, and indoor and outdoor PM-bound PAH concentrations for different participants, spaces, and cities worldwide in recent years. They conclude, “the total health effects of PAHs are typically underestimated. A more effective measure of global health risk assessment of the exposure to PM-bound PAHs should be developed in the future.”
The Science – What do PAHs do?
LINK 6 Environmental Chemicals Cause Cancer
Chemical Carcinogens, Mutagens and Cancer
The process of development of human tumors is complex, (Hanahan and Weinberg, 2011), but the underlying cause of the process is mutation of DNA. “Most evidence points to a multi-step process of sequential alterations in several, often many, oncogenes, tumor-suppressor genes, or microRNA genes in cancer cells” (Carlo and Croce, 2008).
Carcinogens are classified according to their mode of action as genotoxic or nongenotoxic carcinogens. Genotoxic carcinogens initiate carcinogenesis by direct interaction with DNA, resulting in DNA damage or chromosomal aberrations that can be detected by genotoxicity tests eg. Ames Test (Claxton et al, 2010). Nongenotoxic carcinogens are agents that, at least initially, indirectly interact with DNA. These indirect modifications to DNA structure, amount, or function may result in altered gene expression or signal transduction (OECD, 2006).
A large range of chemical mutagens have been found to cause cancer in animal models. The most potent mutagens tend to be the most potent carcinogens. Gold et al (1991)
Environmental Carcinogens
There are many reviews of environmental chemicals causing cancer, Vineis and Xun (2009), Grant (2009), and World Health Organization(2000).
The effect of carcinogens in mixtures is complex and synergistic effects often occur. Cancer risks from chemical carcinogens in complex mixtures such as environmental samples can be much greater than for individual chemicals. Warshawsky et al (1993)
Cancer takes many years to develop after mutagen exposure
Little (2009) studied cancer in Japanese atomic bomb survivors. “Leukemia was the first cancer to be associated with atomic-bomb radiation exposure, with preliminary indications of an excess among the survivors within the first five years after the bombings. An excess of solid cancers became apparent approximately ten years after radiation exposure.” So after exposure to mutagens, Leukemia occurred within the first 5 years, but solid tumours occurred ten years after radiation exposure in adults.
In children, solid tumours develop earlier. After Chernobyl, increase in thyroid cancer incidence in children, was reported as early as 4 years after the accident, particularly in the Gomel area of Belarus. Antonelli et al (1996)
LINK 7 PAHs are by far the most potent environmental carcinogens
PAHs have the perfect structure to bind to DNA and cause mutations
Polycyclic Aromatic Hydrocarbons (PAHs) and their derivatives are among the most potent carcinogens. Having structures that resemble the base pair in DNA, they can readily enter the hydrophobic centre of DNA, binding strongly (intercalation) and disrupting DNA function. When they have been activated by the addition of epoxy or nitro groups, covalent bonding to DNA results, causing permanent mutation. Lerman (1961) and Ames et al (1972)
The carcinogenic potency of PAHs in air
The World Health Organization (Choi et al, 2010), and United States Environmental Protection Agency (2017) have determined the Inhalation Unit Risk for Benzo(a)pyrene, asbestos and benzene. Relative potency factors have been determined by United States Environmental Protection Agency (2010). Some of these values are shown in Table 1.
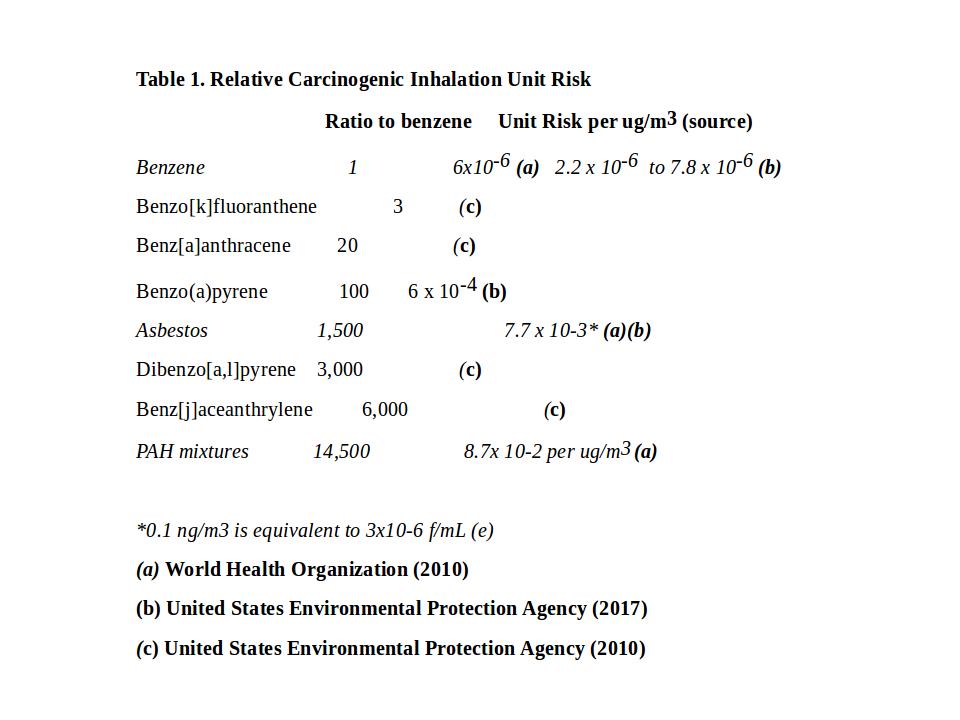
Yang et al (2021) have summarised the reference data of the 16 PAHs most studied, and nominated to be of cancer risk in environmental assessments. This data includes toxicity equivalency factor (TEF) and relative potency factors (RPF) regarding their cancer risks compared to benzo(a)pyrene (see Table 7). There are hundreds more PAHs yet to be studied.
Agent Orange compared to PAHs
The adverse health effects of Agent Orange result from traces of dioxin impurities which are carcinogenic. The main carcinogenic compound, 2,3,7,8-tetrachlorodibenzo-p-dioxin (TCDD) has an Oral Cancer Slope Factor (CSF)-1 of 1×10 5 /mg/ kg/day Simon et al (2009). TCDD was a trace (typically 2-3 ppm, ranging from 50 ppb to 50 ppm), Young et al (1976). Taking a range of 2 ppm to 50 ppm, the effective Oral Cancer Slope Factor for Agent Orange would be .05 to .25/mg/ kg/day, compared to 1/mg/ kg/day for the PAH, Benzo[a]pyrene (United States Environmental Protection Agency, 2017) or 11.5/mg/ kg/day for Benzo[a]pyrene in mixtures of PAHs. Schneider et al (2002)
PAHs in smoke cause many different types of cancer
Cigarette smoking has been shown to cause breast cancer and liver cancer, as well as lung cancer. Xue et al, 2011, found active smoking, especially smoking before first birth is associated with a modest increase in the risk of breast cancer (1.18; 1.10-1.27 for every increase of 20 pack-years).
In a Meta-analysis of epidemiological studies on cigarette smoking and liver cancer, Lee at el (2009), found that compared with never smokers, the adjusted mRR for liver cancer was 1.51 [95% confidence interval (CI) 1.37–1.67] for current smokers and 1.12 (95% CI 0.78–1.60) for former smokers.
In 2010, an IRAC working group reviewed the carcinogenic risks to humans of household use of solid fuels. They found increased cancer risk for cancer of the oral cavity, pharynx and larynx, cancer of the kidney (renal-cell carcinoma) and salivary glands (IRAC, 2010). Josuya et al, 2015, conducted a meta-analysis of household air pollution and cancers other than lung. In addition to those previously mentioned he found increased risk for cervical cancer and oesophageal cancer.
Sheikh M, et al (2020) found increased oesophageal cancer, HR 1.89 (1.02, 3.50), and gastric cancer HR 1.83 (1.01, 3.31). In China during 2004 to 2008, tobacco smoking and solid fuel use for cooking were independently associated with increased risks of liver cancer, with hazard ratios (95% confidence intervals [CIs]) of 1.28 (1.15-1.42) and 1.25 (1.03-1.52), respectively, Wen et al 2022.
People living in wildfire areas in Canada have been shown to have increased brain cancer as well as lung cancer Korsiak et al, 2022. Finkel (2016) found evidence for increased bladder cancer as well as lung cancer, in counties with shale gas activity where PAHs are liberated into air and water.
Examples of environmental PAHs from different sources causing cancer are given in the relevant sections below.
LINK 8 PAHs are causing cancer now
Scientists have been aware of the cancer risks from PAHs for some time.
Chimney sweeps were known to develop cancer of the scrotum. In 1775 an English physician, Percivall Pott, reported a causal link between cancer of the scrotum (later found to be squamous cell carcinoma) and soot exposure (Pott, 1775). It was not until 1930 that scrotal cancer in chimney sweeps was linked to absorption of polycyclic aromatic hydrocarbons from coal tar (Cook et al, 1933). From then studies of PAHs led to the mechanism of DNA adduct formation and cancer initiation. Lippman et al (2009)
It wasn’t until the 1980s that the U.S. EPA (1982) and the IARC (1987) classified a number of PAHs as carcinogenic to animals and some PAH-rich mixtures as carcinogenic to humans. The human classification was based on increased incidence of cancer in coke-oven workers. In 2010, the World Health Organization (Choi et al, 2010) determined cancer risk factors for PAH mixtures in air. “Based on epidemiological data from studies on coke-oven workers, a unit risk for lung cancer for PAH mixtures is estimated to be 8.7 × 10⁻⁵ per ng/m3 of B[a] P. This is the guideline for PAH in indoor air. The corresponding concentrations for lifetime exposure to B[a]P producing excess lifetime cancer risks of 1/10 000, 1/100 000 and 1/1 000 000 are approximately 1.2, 0.12 and 0.012 ng/m3, respectively.”
Cancer from Cigarette Smoke
PAHs have been shown to be the chemicals in cigarette smoke causing lung cancer. “PAHs, carcinogenic compounds present in tobacco smoke, induce mutations in the p53 gene, which is crucial for cell cycle dysregulation and carcinogenesis.” Vineis et al (2004).
“G to T transversions within the p53 gene have been linked to a molecular signature of tobacco mutagens (PAH DNA adducts) in smoking-associated lung cancers for the following reasons:
1) PAHs are a major class of carcinogens in tobacco smoke that produce predominantly G to T transversions;
2) PAH adducts are present in DNA extracted from human tissues exposed to tobacco smoke;
3) the frequency of G to T transversions in lung cancers from smokers is increased relative to the frequency in lung cancers from non-smokers;
4) a nontranscribed strand bias of G to T transversions can be attributed to the preferential repair of adducts on the transcribed strand. Hainaut et al (2001).“
With the 10+ year delay from exposure to PAHs to the development of cancer, and industry suppressing the science, it took many years to convince governments that PAHs in cigarette smoke were causing cancer. Bero (2005) and Brandt (2012). have described the manipulation of research by the tobacco industry.
According to the International Agency for Research on Cancer Working Group, there is now “sufficient” evidence of tobacco smoking causing increased cancer of the lung (15 to 30 times that of non-smokers) urinary tract (3 times) and upper aero-digestive tract (1.5 to 4 times). See table 2, Vineis et al (2004).
LINK 9 Cancer from industrial PAHs
By 1996, there were many epidemiological studies reporting direct evidence of the carcinogenic effects of PAHs in occupationally-exposed subjects. “Risks of lung and bladder cancer were dose dependent when PAHs were measured quantitatively and truly non-exposed groups were chosen for comparison” Mastrangelo et al (1996). This paper stated that “safe levels” needed to be reduced. “These new findings suggest that the current threshold limit value of 0.2 mg/m3 of benzene soluble matter (which indicates PAH exposure) is unacceptable because, after 40 years of exposure, it involves a relative risk of 1.2-1.4 for lung cancer and 2.2 for bladder cancer.”
Garcia‐Perez et al (2009) studied mortality due to lung, laryngeal, and bladder cancer in towns in Spain lying in the vicinity of industrial combustion installations. “Lung cancer displayed excess mortality for all types of fuel used, whereas in laryngeal and bladder cancer, the excess was associated with coal-fired industries. There was a risk gradient effect in the proximity of a number of installations.“
Petit et al (2019) in a study of 93 exposure groups belonging to 9 industries, estimated the lung cancer risk for workers exposed to polycyclic aromatic hydrocarbons in various industries. They found the risk probabilities were greatest for coke and silicon production; then came the manufacturing of carbon products and aluminum production; then foundries and combustion processes; then for the use of lubricating oils and engine exhaust emissions; and least for bitumen. They concluded, “despite efforts and changes that had been made to decrease risks, PAHs remain a sanitary threat for people exposed to these pollutants in occupational environments.”
LINK 10 Cancer from domestic burning of wood and coal
Almost 3 billion people worldwide rely on fuels such as wood, coal, crop waste, animal dung, or charcoal for cooking and heating. (World Health Organization 2018). They are exposed to indoor PAH emissions daily, when these fuels are burnt, usually in inefficient stoves. In a meta-analysis of 476 studies (15·5 million participants) from 123 nations (80% of which were classified as low income and middle income) Lee et al (2020) found household air pollution was positively associated with lung cancer mortality (Relative Risk 1·69, 95% CI 1·44–1·98). Household air pollution was associated with 1·8 million (95% CI 1·1–2·7) deaths and 60·9 million (34·6–93·3) DALYs in 2017, with the burden overwhelmingly experienced in low-income and middle-income countries. (The disability-adjusted life year (DALY) is the number of years lost due to ill-health, disability or early death).
The relative risk for lung cancer associated with household coal use is even higher, “odds ratio (OR) = 2.15; 95% confidence interval (CI) = 1.61-2.89”, Hosgood et al (2011), in line with higher PAH emissions. “Stratification by regions of mainland China and Taiwan found a variation in effects across the regions, with south/southeastern (OR = 3.27; 95% CI = 1.27-8.42, N(studies) = 3) and southwestern China (OR = 2.98; 95% CI = 1.18-7.53, N(studies) = 3) experiencing the highest risk.” These regions have coal with higher PAHs compared the the coal used in other regions.
“Lung cancer rates among men and particularly among women, almost all of whom are non-smokers, in Xuan Wei County, China are among the highest in China and have been causally associated with exposure to indoor smoky coal emissions that contain very high levels of polycyclic aromatic hydrocarbons (PAHs).“ Lan et al (2004) found SNPs in the oxidative stress-related genes AKR1C3 and OGG1 were associated with increased risk of lung cancer, indicating genes that activate PAHs play a role in the pathogenesis of lung cancer in this population.
LINK 11 Cancer from fossil fuel mining
Increased cancer near mining from coal mining USA and China.
Environmental exposures related to the coal-mining industry could contribute to the high incidence of lung cancer in southeastern Kentucky, Christian et al (2011). They identified three clusters of counties with higher-than-expected rates (of lung cancer). Cluster 1 (relative risk [RR] = 1.21, p<0.01) included 12 counties in southeastern Kentucky. Cluster 2 (RR=1.17, p<0.01) included three nearby counties in the same region. Several of the 15 counties in Cluster 3 (RR=1.04, p=0.01) were part of the Louisville, Kentucky, or Cincinnati, Ohio, metropolitan areas. All of the counties in Clusters 1 and 2 produced significant amounts of coal.
Hosgood et al (2012) found increased lung cancer among coal miners in Xuanwei, China. “We observed an increased risk of lung cancer among coal miners (OR = 2.7; 95%CI = 1.3-5.6) compared to non-coal miners. Further, a dose-response relationship was observed for the risk of lung cancer and the number of years working as a coal miner (P(trend) = 0.02), with those working as miners for more than 10 years experiencing an almost fourfold increased risk (OR = 3.8; 95%CI = 1.4-10.3) compared to non-coal miners.”
Cancer attributed to Unconventional Gas Development in USA
From measurements of air-borne PAHs in the vicinity of unconventional gas wells, McKenzie et al (2012), have estimated nearly double the cancer risk from chemical exposure for Colorado residents living less than half a mile form gas wells compared to those living greater than half a mile away. Finkel (2016) found evidence for increased bladder cancer in data from the Pennsylvania Cancer Registry. The observed number of urinary bladder cases was higher than expected in both sexes in counties with shale gas activity. The increase correlated with the number of producing wells; “in counties with the fewest number of producing wells, the increase was essentially non-existent.“
Other studies have been clouded by industry funded publications.
LINK 12 Increased neoplasms in Queensland children in coal mining and CSG areas
Werner et al (2018) analysed child and adolescent hospital admission rates in Queensland and compared a coal seam gas area (CSG), a coal mining area (CHI) and a control area (RLI – no mining). “Adjustment for covariates revealed a 95% increase per year in ‘Neoplasms’ admission rates in the CSG area relative to the RLI area.” This needs further study, but indicates that childhood cancer could be nearly doubled in the CSG area. “The CHI area also showed an increase of 94% per year relative to the RLI area.“ This data points to a carcinogen liberated by both CSG and open-cut coal mining; PAH’s are a prime contender. This needs further study, and follow-up data is available.
LINK 13 Cancer from Wildfires
Increased PAH exposure in firefighters
In a UK study, Stec et al (2018) measured PAHs on working firefighters. “PAH carcinogens including benzo[a]pyrene (B[a]P), 3-MCA, and 7,12-dimethylbenz[a]anthracene PAHs were determined on body surfaces (eg. hands, throat), on PPE including helmets and clothing, and on work surfaces. The main exposure route would appear to be via skin absorption. Cancer slope factors, used to estimate cancer risk, indicate a markedly elevated risk. These results suggest an urgent need to monitor exposures to firefighters in their occupational setting and conduct long-term follow-up regarding their health status.”
Firefighters exposed to PAHs from firefighting activities and smoking, have increased levels of urinary monohydroxyl-polycyclic aromatic hydrocarbons (OHPAHs). In a study of wildland firefighters, Olivera et al (2017) found ‘’Regular consumption of tobacco increased 76-412% ∑OH-PAHs. Fire combat activities promoted significant increments of 158-551% ∑OH-PAHs. 2OHFlu was the most affected compound by firefighting activities (111-1068%), while 1OHNaph+1OHAce presented the more pronounced increments due to tobacco consumption (22-339%).” This suggests urinary levels of these biomarkers could be useful for the surveillance of firefighters’ health and to better estimate the potential short-term health risks of diseases related to PAH exposure.
Increased risk of Lung Cancer in firefighters
Navarro et al (2019) estimated the relative risk of lung cancer from PAHs using existing PM2.5 exposure-response relationships. They measured PM4 concentrations from smoke and breathing rates from wildland firefighter field studies across different exposure scenarios. “Across all exposure scenarios (49 and 98 fire days per year) and career durations (5-25 years), we estimated that wildland firefighters were at an increased risk of lung cancer (8 percent to 43 percent).”
Many studies have found evidence of increased cancer in firefighters, compared to the normal population. Two recent meta-analyses of the data, found that several types of cancer are more frequent in firefighters than in the general population. Soteriades E S et al (2019) have found “statistically significant associations between firefighting and cancers of bladder, brain and CNS, colorectal cancers, non-Hodgkin’s lymphoma, skin melanoma, prostate, and testicular cancer.” Laroche et al (2021) reported “a significant increase in the incidence of rectal, prostate, bladder, and testicular cancers as well as mesothelioma and malignant melanoma in firefighters compared to the general population.”
Glass et al (2017) looked at mortality and cancer incidence among male volunteer Australian firefighters (wildfire fighters). “Prostate cancer incidence was increased compared with the general population, but this was not related to the number of incidents attended. Kidney cancer was associated with increased attendance at fires, particularly structural fires. The overall risk of mortality was significantly decreased, and all major causes of death were significantly reduced for volunteer firefighters. Compared with the general population, there were significant decreases in overall cancer incidence and in most major cancer categories. Volunteer firefighters have a reduced risk of mortality and cancer incidence compared with the general population, which is likely to be a result of a ‘healthy-volunteer’ effect and, perhaps, lower smoking rates.”
Studies of urinary levels of OHPAHs are needed in wildfire fighters and people exposed to to bushfire smoke during mega fires to determine PAH exposure and cancer risk from this exposure. Follow-up studies are needed in 15 years time to ascertain the levels of cancer from mega fires.
Increased cancer in the general poulation living in wildfire areas.
A recent Canadian study (Korsiak et al, 2022) utilised data from more than 2 million people followed up for a median of 20 years. “Wildfire exposure was associated with slightly increased incidence of lung cancer and brain tumours. For example, cohort members exposed to a wildfire within 50 km of residential locations in the past 10 years had a 4·9% relatively higher incidence (adjusted hazard ratio [HR] 1·049, 95% CI 1·028-1·071) of lung cancer than unexposed populations, and a 10% relatively higher incidence (adjusted HR 1·100, 1·026-1·179) of brain tumours. Similar associations were observed for the 20 km buffer size. Wildfires were not associated with haematological cancers in this study, and concentration-response trends were not readily apparent when area burned was modelled as a continuous variable.”ancer in the general poulation living in wildfire areas.
As solid tumours appear more than 10 years after initiation by mutagens (Little, 2009) exposure up to 10 years may give a gross underestimate of long term cancer incidence. Analysis of people exposed in the last 20 yrs is needed to ascertain the long term incidence of cancer after exposure to wildfire smoke.
Consideration also needs to be given for the escalation of Wildfires since 2015, increasing the incidence of cancer beyond what is indicated by the analysis of (Korsiak et al, 2022).
Global cancer cases attributed to Pahs
Global cancer case numbers are from Bray et al 2024. This article presents global cancer statistics for the year 2022 based on updated estimates from the International Agency for Research on Cancer (IARC).
Most lung cancer from smoking can be attributed to PAHs. DNA adduct studies show NNK and PAHs, the main mutagens in cigarette smoke, both cause mutations that could lead to lung cancer. However, “the distribution of G to T transversions in lung cancer is consistent with the adduct spectrum and precise mutational specificity of PAH compounds” Pfeifer et al 2002.
World Health Organization (2024) estimates there were 4.2 million deaths from household air pollution in 20, and 6% (190,000) were lung cancer. Lee et al (2020) found in 2017 household air pollution was associated with 1·8 million (95% CI 1·1–2·7) deaths. Using the value of 6% being lung cancer, this amounts to 108,000 deaths from lung cancer, mostly attributable to PAHs.
Ambient (outdoor) air pollution is estimated to have caused 4.2 million premature deaths worldwide in 2019, and 4% of deaths (168,000) were due to lung cancers, World Health Organization (2024).
The number of cases of lung cancer attributable to PAHs in cigarette smoke (1,703,000) will include those also exposed to ambient, household and industrial smoke. For non-smokers, the number of lung cancer cases from these sources is likely to be at least 23,000 (50% of non-smoker lung cancer). So the total number of cases each year for lung cancer from PAHs in smoke would be 1,726,000.
For evidence of other types of cancer from PAHs in smoke and PAHs in barbequed and smoked food please see the relevant sections.
Cancer from PFAS
Exposure of Mid-Ohio Valley residents to PFOA in drinking water due to chemical plant emissions, was associated with kidney and testicular cancer, Barry et al, 2013. Vieira et al, 2013, investigated the relationship between PFOA exposure and cancer among residents living near the DuPont Teflon-manufacturing plant in Parkersburg, West Virginia. Their results suggest that higher PFOA serum levels may be associated with testicular, kidney, prostate, and ovarian cancers and non-Hodgkin lymphoma.
Law et al 2023, found higher rates of laryngeal cancer, lung cancer, and prostate cancer, in Australian communities with PFAS environmental contamination associated with firefighting foams.
14 Future cancer from wildfires in Australia
“The PM 2.5 levels in Sydney during the 2019-20 bushfire season spiked to extremely high levels; with the hourly readings reaching up to 600 (μg/m3)
and 800 for parts of the city (see Figure 1.5). And parts of regional NSW had significantly worse readings (see Figure 1.6). For example, Goulburn’s hourly reading at one point in early 2020 went over PM 2.5 levels of 2,000.” Duckett et al (2020).
Muller and Muller (2015) have estimated “the average person in China, who typically breathes 52 μg/m3 of air pollution, is receiving a health impact equivalent to smoking 2.4 cigarettes per day”. Using these values, a PM 2.5 value of 400 μg/m3 is equivalent to smoking 18.46 cigarettes per day.
REFERENCES
Adeniji et al (2018)Adeniji, Abiodun Olagoke and Okoh, Omobola Oluranti and Okoh, Anthony Ifeanyi. Analytical Methods for Polycyclic Aromatic Hydrocarbons and their Global Trend of Distribution in Water and Sediment: A Review. 2018. scienceopen.com.
Adeniji et al (2019). Adeniji AO, Okoh OO, Okoh AI. Levels of Polycyclic Aromatic Hydrocarbons in the Water and Sediment of Buffalo River Estuary, South Africa and Their Health Risk Assessment. Arch Environ Contam Toxicol. 2019 May;76(4):657-669.
Ames et al (1972). Ames, BN., Gurney, EG., Miller, JA. et al. Carcinogens as frameshift mutagens: metabolites and derivatives of 2-acetylaminofluorene and other aromatic amine carcinogens. Proc. Natl. Acad. Sci. U.S.A. 1972, 69, 3128-3132.
Antonelli et al (1996). Antonelli A, Miccoli P, Derzhitski VE, Panasiuk G, Solovieva N, Baschieri L. Epidemiologic and clinical evaluation of thyroid cancer in children from the Gomel region (Belarus). World J Surg. 1996 Sep;20(7):867-71.
Barry et al, 2013. Perfluorooctanoic Acid (PFOA) Exposures and Incident Cancers among Adults Living Near a Chemical Plant. Environmental Health Perspectives Volume 121(11-12),1313 – 1318.
Batley et al (2012). Batley, GS., and Kookana, R S., Environmental issues associated with coal seam gas recovery: managing the fracking boom. Environmental Chemistry (2012) 9(5) 425-428.
Bero (2005). Bero LA. Tobacco industry manipulation of research. Public Health Rep. 2005;120(2):200-208.
Berthiaume et al (2021). Berthiaume A, Galarneau E, Marson G. Polycyclic aromatic compounds (PACs) in the Canadian environment: Sources and emissions. Environ Pollut. 2021 Jan 15;269:116008.
Brandt (2012). Brandt AM. Inventing conflicts of interest: a history of tobacco industry tactics. Am J Public Health. 2012;102(1):63-71.
Bray et al 2024. Global cancer statistics 2022: GLOBOCAN estimates of incidence and mortality worldwide for 36 cancers in 185 countries. CA Cancer J Clin. 2024 May-Jun;74(3):229-263.
Campos et al (2019). Campos, I. et al. Forest fires as potential triggers for production and mobilization of polycyclic aromatic hydrocarbons to the terrestrial ecosystem. Land Degrad. Dev. 30, 2360–2370 (2019).
Carlo and Croce (2008). Carlo, M. and Croce, MD. (2008). Oncogenes and Cancer . N. Engl. J. Med. 358, 502-511.
Choi et al (2010). Choi H, Harrison R, Komulainen H, et al. Polycyclic aromatic hydrocarbons. In: WHO Guidelines for Indoor Air Quality: Selected Pollutants. Geneva: World Health Organization; 2010, 6.
Claxton et al (2010). Claxton, LD., Umbuzeiro, GDA. and DeMarini, DM. (2010). The Salmonella mutagenicity assay: the stethoscope of genetic toxicology for the 21st century. Environ. Health Perspect. 118, 1515-1522.
Cook et al (1933). Cook JW, Hewett CL, Hieger I. The isolation of a cancer-producing hydrocarbon from coal tar. Parts I, II, and III. J Chem So (Resumed) 1933:395–405.
De Souza and Corrêa (2016) C.V. de Souza, S.M. Corrêa. Fuel 185 (2016) 925–931
Duckett et al (2020). Stephen Duckett, Will Mackey, and Anika Stobart, The health effects of the 2019-20 bushfires.Submission to the Royal Commission into National Natural Disaster Arrangements.Gratin Institute. https://grattan.edu.au/wp-content/uploads/2020/04/Grattan-Institute-submission-to-Royal-Commission.pdf
Duedahl-Olesen et al (2021). Duedahl-Olesen L, Ionas AC. Formation and mitigation of PAHs in barbecued meat – a review. Crit Rev Food Sci Nutr. 2021 Jan 7:1-16.
Elliott et al (2017). Elise G. Elliott, Pauline Trinh, Xiaomei Ma, Brian P. Leaderer, Mary H. Ward, Nicole C. Deziel, Unconventional oil and gas development and risk of childhood leukemia: Assessing the evidence, Science of The Total Environment,Volume 576, 2017, Pages 138-147.
Finkel (2016). Finkel, M L. (2016). Shale gas development and cancer incidence in southwest Pennsylvania. Public Health 2016 Dec;141:198-206.
Garcia‐Perez et al (2009). Garcia‐Perez J, Pollan M, et al (2009). Mortality due to lung, laryngeal and bladder cancer in towns lying in the vicinity of combustion installations. Science of the Total Environment 407(8): 2593‐2602.
Gold et al (1991). Gold LS, Slone TH, Manley NB, Garfinkel GB, Hudes ES, Rohrbach L, Ames BN. The Carcinogenic Potency Database: analyses of 4000 chronic animal cancer experiments. published in the general literature and by the U.S. National Cancer Institute/National Toxicology Program. Environ Health Perspect. 1991 Dec; 96:11-5.
Grant (2009). Grant, WB. (2009). Air pollution in relation to U.S. cancer mortality rates: an ecological study; likely role of carbonaceous aerosols and polycyclic aromatic hydrocarbons. Anticancer Res. 29, 3537-3545.
Gustafson et al (2008). Gustafson P, Ostman C, Sällsten G. Indoor levels of polycyclic aromatic hydrocarbons in homes with or without wood burning for heating. Environ Sci Technol. 2008 Jul 15;42(14):5074-80.
Hainaut et al (2001). Hainaut P, Pfeifer GP. Patterns of p53 G to T transversions in lung cancers reflect the primary mutagenic signature of DNA-damage by tobacco smoke. Carcinogenesis 2001;22:367–74.
Hanahan and Weinberg (2011). Hanahan, D. and Weinberg, RA. (2011). Hallmarks of cancer: the next generation. Cell 144, 646-674.
Hosgood et al (2011). Hosgood HD 3rd, Wei H, Sapkota A, Choudhury I, Bruce N, Smith KR, Rothman N, Lan Q. Household coal use and lung cancer: systematic review and meta-analysis of case-control studies, with an emphasis on geographic variation. Int J Epidemiol. 2011 Jun;40(3):719-28.
Hosgood et al (2012) Hosgood HD 3rd, Chapman RS, Wei H, He X, Tian L, Liu LZ, Lai H, Engel LS, Chen W, Rothman N, Lan Q. Coal mining is associated with lung cancer risk in Xuanwei, China. Am J Ind Med. 2012 Jan;55(1):5-10.
Hussein et al (2016). Hussein I. Abdel-Shafy, Mona S.M. Mansour,A review on polycyclic aromatic hydrocarbons: Source, environmental impact, effect on human health and remediation, Egyptian Journal of Petroleum, Volume 25, Issue 1(2016) 107-123.
IARC (1987). Overall evaluations of carcinogenicity: an updating of IARC Monographs volumes 1 to 42. IARC Monogr Eval Carcinog Risks Hum Suppl. 1987;7:1-440. PMID: 3482203.
IRAC 2010. IARC Working Group on the Evaluation of Carcinogenic Risks to Humans. Household use of solid fuels and high-temperature frying. IARC Monogr Eval Carcinog Risks Hum. 2010;95:1-430.
IARC (2012). IARC monograph. Chemical agents,and related occupations, volume 100 F A review of human carcinogens monographs.iarc.fr/ENG/Monographs/vol100F/mono100F-17.pdf.
Josuya et al, 2015. Household air pollution and cancers other than lung: a meta-analysis. Environ Health. 2015 Mar 15;14:24.
Korsiak et al (2022). Long-term exposure to wildfires and cancer incidence in Canada: a population-based observational cohort study. Lancet Planet Health. 2022 May;6(5):e400-e409.
Lan et al (2004). Lan Q, Mumford JL, Shen M, Demarini DM, Bonner MR, He X, Yeager M, Welch R, Chanock S, Tian L, Chapman RS, Zheng T, Keohavong P, Caporaso N, Rothman N. Oxidative damage-related genes AKR1C3 and OGG1 modulate risks for lung cancer due to exposure to PAH-rich coal combustion emissions. Carcinogenesis. 2004 Nov;25(11):2177-81.
Laroche et al (2021). Laroche E, L’Espérance S. Cancer Incidence and Mortality among Firefighters: An Overview of Epidemiologic Systematic Reviews. Int J Environ Res Public Health. 2021 Mar 3;18(5):2519.
Law et al 2023. Relative rates of cancers and deaths in Australian communities with PFAS environmental contamination associated with firefighting foams: A cohort study using linked data. Cancer Epidemiol. 2023 Feb;82:102296.
Lee at el, 2009. Meta-analysis of epidemiologic studies on cigarette smoking and liver cancer, International Journal of Epidemiology, Volume 38, Issue 6, December 2009, Pages 1497–1511.
Lee et al (2016). Lee JG, Kim SY, Moon JS, Kim SH, Kang DH, Yoon HJ. Effects of grilling procedures on levels of polycyclic aromatic hydrocarbons in grilled meats. Food Chem. 2016 May 15;199:632-8.
Lee et al (2020). Lee KK, Bing R, Kiang J, Bashir S, Spath N, Stelzle D, Mortimer K, Bularga A, Doudesis D, Joshi SS, Strachan F, Gumy S, Adair-Rohani H, Attia EF, Chung MH, Miller MR, Newby DE, Mills NL, McAllister DA, Shah ASV. Adverse health effects associated with household air pollution: a systematic review, meta-analysis, and burden estimation study. Lancet Glob Health. 2020 Nov;8(11):e1427-e1434.
Lerman (1961). Lerman, LS. Structural considerations in the interaction of DNA and acridines. J. Mol. Biol. 1961, 3, 18-30.
Lippman et al (2009). Lippman SM, Hawk ET. Cancer prevention: from 1727 to milestones of the past 100 years. Cancer Res. 2009 Jul 1;69(13):5269-84.
Little (2009) Little MP. Cancer and non-cancer effects in Japanese atomic bomb survivors. J Radiol Prot. 2009 Jun;29(2A):A43-59.
Lloyd-Smith and Sengen (2011). NTN Report Sept 2011: Hydraulic Fracturing in Coal Seam Gas Mining: The Risks to Our Health, Communities, Environment and Climate.
Menzie et al (1992). Menzie, C A, Potocki, B B ,Santodonato, J, Exposure to carcinogenic PAHs in the environment. Environ. Sci. Technol. 1992, 26, 7.
McDonald et al (2005). McDonald, TA. and Komulainen, H. (2005). Carcinogenicity of the chlorination disinfection by-product MX. J Environ Sci Health C Environ Carcinog Ecotoxicol Rev 23, 163-214.
McKenzie et al (2012). McKenzie, LM., Witter, RZ., Newman, LS. et al. (2012). Human health risk assessment of air emissions from development of unconventional natural gas resources. Sci. Total Environ. 424, 79-87.
Minnesota Department of Health (2016). Guidance for Evaluating the Cancer Potency of Polycyclic Aromatic Hydrocarbon (PAH) Mixtures in Environmental Samples Minnesota Department of Health February 8, 2016.
Mojiri et al (2019).Amin Mojiri, John L. Zhou, Akiyoshi Ohashi, Noriatsu Ozaki, Tomonori Kindaichi, Comprehensive review of polycyclic aromatic hydrocarbons in water sources, their effects and treatments,Science of The Total Environment, Volume 696, 2019, 133971.
Muller and Muller (2015). Muller RA, Muller EA. Air pollution and cigarette equivalence. Berkeley Earth. https://berkeleyearth.org/air-pollution-and-cigarette-equivalence (viewed July 2022).
Navarro et al (2019). Navarro KM, Kleinman MT, Mackay CE, Reinhardt TE, Balmes JR, Broyles GA, Ottmar RD, Naher LP, Domitrovich JW. Wildland firefighter smoke exposure and risk of lung cancer and cardiovascular disease mortality. Environ Res. 2019 Jun;173:462-468.
NCBI APPENDIX A, LISTS OF POLYCYCLIC AROMATIC HYDROCARBONS
https://www.ncbi.nlm.nih.gov/books/NBK217760/
NRC (US) Committee on Pyrene and Selected Analogues (1983). National Research Council (US) Committee on Pyrene and Selected Analogues. Polycyclic Aromatic Hydrocarbons: Evaluation of Sources and Effects. Washington (DC): National Academies Press (US); 1983. 2, Polycyclic Aromatic Hydrocarbons from Natural and Stationary Anthropogenic Sources and their Atmospheric Concentrations. Available from: https://www.ncbi.nlm.nih.gov/books/NBK217758/
OECD (2006). OECD (2006). Detailed review paper on cell transformation assays for detection of chemical carcinogens. DRP No. 31. Fourth draft version.
Olivera et al (2017). Oliveira M, Slezakova K, Magalhães CP, Fernandes A, Teixeira JP, Delerue-Matos C, do Carmo Pereira M, Morais S. Individual and cumulative impacts of fire emissions and tobacco consumption on wildland firefighters’ total exposure to polycyclic aromatic hydrocarbons. J Hazard Mater. 2017 Jul 15;334:10-20.
Oliveira et al (2020). Oliveira M, Capelas S, Delerue-Matos C, Morais S. Grill Workers Exposure to Polycyclic Aromatic Hydrocarbons: Levels and Excretion Profiles of the Urinary Biomarkers. Int J Environ Res Public Health. 2020 Dec 30;18(1):230.
Orem et al (2007). W. H. Orem, C. A. Tatu, H. E. Lerch, C. A. Rice, T. T. Bartos, A. L. Bates, S. Tewalt, M. D. Corum, Organic compounds in produced waters from coalbed natural gas wells in the Powder River Basin, Wyoming, USA. Appl. Geochem. 2007, 22, 2240-2256.
Petit et al, 2019. Petit P, Maître A, Persoons R, Bicout DJ. Lung cancer risk assessment for workers exposed to polycyclic aromatic hydrocarbons in various industries. Environ Int. 2019 Mar;124:109-120.
Pfeifer et al, 2002. “Tobacco smoke carcinogens, DNA damage and p53 mutations in smoking-associated cancers.” Oncogene 21.48 (2002): 7435-7451.
Pott (1775). Pott P. Cancer Scroti. In: Chirurgical observations relative to the cataract, the polypus of the nose, cancer of the scrotum, different kinds of ruptures, and the mortification of the toes and feet. London: Hawes, Clarke, Collins; 1775. p. 63–8.
Rodgman et al (2006). Rodgman A. and Perfetti T. (2006) The Composition of Cigarette Smoke: A Catalogue of the Polycyclic Aromatic Hydrocarbons. Contributions to Tobacco & Nicotine Research, Vol.22 (Issue 1), pp. 13-69. https://doi.org/10.2478/cttr-2013-0817
Saito et al (2014). Saito E, Tanaka N, Miyazaki A, Tsuzaki M. Concentration and particle size distribution of polycyclic aromatic hydrocarbons formed by thermal cooking. Food Chem. 2014 Jun 15;153:285-91.
Santos and Maher (2012). Santos, I., and Maher, D., (2012) Santos I, Maher D. Submission on National Greenhouse and Energy Reporting (Measurement) Determination 2012 – Fugitive Emissions from Coal Seam Gas. Southern Cross University, 2012
Schneider et al (2002). Schneider K, Roller M, Kalberlah F, Schuhmacher-Wolz U. Cancer risk assessment for oral exposure to PAH mixtures. J Appl Toxicol. 2002 Jan-Feb;22(1):73-83.
Sheikh M, et al (2020). Household Fuel Use and the Risk of Gastrointestinal Cancers: The Golestan Cohort Study. Environ Health Perspect. 2020 Jun;128(6):67002.
Shultz (1972). Shultz, J.L., R.A.Friedel, and A.G.Sharkey, Jr. Detection of organic compounds in respiratory coal dust by high-resolution mass spectrometry. Bureau of Mines Technical Progress Report 61. Pittsburgh, Pa.: Bureau of Mines, 1972.
Shen et al (2013).Shen H, Huang Y, Wang R, Zhu D, Li W, Shen G, Wang B, Zhang Y, Chen Y, Lu Y, Chen H, Li T, Sun K, Li B, Liu W, Liu J, Tao S. Global atmospheric emissions of polycyclic aromatic hydrocarbons from 1960 to 2008 and future predictions. Environ Sci Technol. 2013 Jun 18;47(12):6415-24.
Simon et al (2009).Ted Simon, Lesa L. Aylward, Christopher R. Kirman, J. Craig Rowlands, Robert A. Budinsky, Estimates of Cancer Potency of 2,3,7,8-Tetrachlorodibenzo(p)dioxin Using Linear and Nonlinear Dose-Response Modeling and Toxicokinetics, Toxicological Sciences, Volume 112, Issue 2, December 2009, Pages 490–506
Soteriades E S et al (2019). Soteriades ES, Kim J, Christophi CA, Kales SN. Cancer Incidence and Mortality in Firefighters: A State-of-the-Art Review and Meta-َAnalysis. Asian Pac J Cancer Prev. 2019;20(11):3221-3231. Published 2019 Nov 1.
Stec et al (2018). Stec AA, Dickens KE, Salden M, Hewitt FE, Watts DP, Houldsworth PE, Martin FL. Occupational Exposure to Polycyclic Aromatic Hydrocarbons and Elevated Cancer Incidence in Firefighters. Sci Rep. 2018 Feb 6;8(1):2476.
Strosher (1996). Alberta Research Council (M. Strosher), 1996, Investigations of Flare Gas Emissions in Alberta. Final Report.
United States Environmental Protection Agency (1982). Carcinogen Assessment Of Coke Oven Emissions. U.S. Environmental Protection Agency, Washington, D.C., EPA/600/6-82/003F (NTIS PB84170182), 1982.
United States Environmental Protection Agency (2015). Assessment of the Potential Impacts of Hydraulic Fracturing for Oil and Gas on Drinking Water Resources. EPA/600/R-15/047.
United States Environmental Protection Agency (2010). Development of a Relative Potency Factor (RPF) Approach for Polycyclic Aromatic Hydrocarbon (PAH) Mixtures. External Review Draft; Environmental Protection Agency; Integrated Risk Information System: Washington, DC, USA, 2010.
United States Environmental Protection Agency (2017). Integrated Risk Information System: Washington, DC, USA, IRIS asessments https://iris.epa.gov/ChemicalLanding
Vieira et al, 2013. Perfluorooctanoic acid exposure and cancer outcomes in a contaminated community: a geographic analysis. Environmental health perspectives, 121(3), 318-323.
Vineis and Xun (2009). Vineis, P. and Xun, W. (2009). The emerging epidemic of environmental cancers in developing countries. Ann. Oncol. 20, 205-212.
Vineis et al (2004). P. Vineis, M. Alavanja, P. Buffler, E. Fontham, S. Franceschi, Y. T. Gao, P. C. Gupta, A. Hackshaw, E. Matos, J. Samet, F. Sitas, J. Smith, L. Stayner, K. Straif, M. J. Thun, H. E. Wichmann, A. H. Wu, D. Zaridze, R. Peto, R. Doll. Tobacco and Cancer: Recent Epidemiological Evidence, Journal of the National Cancer Institute, Vol. 96, No. 2, January 21, 2004.
Vu et al 2015. Vu AT, Taylor KM, Holman MR, Ding YS, Hearn B, Watson CH. Polycyclic Aromatic Hydrocarbons in the Mainstream Smoke of Popular U.S. Cigarettes. Chem Res Toxicol. 2015;28(8):1616-1626.
Wang et al (2018).Wang W, Wang L, Shao Z. Polycyclic Aromatic Hydrocarbon (PAH) Degradation Pathways of the Obligate Marine PAH Degrader Cycloclasticus sp. Strain P1. Appl Environ Microbiol. 2018 Oct 17;84(21):e01261-18.
Warshawsky et al (1993). Warshawsky, D., Barkley, W. and Bingham, E. (1993). Factors affecting carcinogenic potential of mixtures. Fundam Appl Toxicol 20, 376-382.
Wen et al, 2022. Tobacco smoking and solid fuels for cooking and risk of liver cancer: A prospective cohort study of 0.5 million Chinese adults. Int J Cancer. 2022 Jul 15;151(2):181-190.
Werner et al (2018). Werner, AK. Watt, K., Cameron C., Vink, S., Page, A., and Jagals, P., (2018). Examination of Child and Adolescent Hospital Admission Rates in Queensland, Australia, 1995–2011: A Comparison of Coal Seam Gas, Coal Mining, and Rural Areas. Matern Child Health J. ; 22(9): 1306–1318.
World Health Organization (1998). Polynuclear aromatic hydrocarbons
in Drinking-water in Guidelines for drinking-water quality, 2nd ed. Addendum to Vol. 2. Health criteria and other supporting information. World Health Organization, Geneva, 1998.
World Health Organization (2000). Air Quality Guidelines for Europe. (2000) World Health Organization. Regional Office for Europe. Copenhagen. WHO Regional Publications, European Series, No. 91.
World Health Organization (2018). WHO Global Health Observatory—data repository. 2018.
World Health Organization (2024a). https://www.who.int/news-room/fact-sheets/detail/household-air-pollution-and-health.
World Health Organization (2024b). https://www.who.int/news-room/fact-sheets/detail/ambient-(outdoor)-air-quality-and-health
Xue et al 2011. F, Willett WC, Rosner BA, Hankinson SE, Michels KB. Cigarette Smoking and the Incidence of Breast Cancer. Arch Intern Med. 2011;171(2):125–133.
Yang et al (2021). Yang L, Zhang H, Zhang X, Xing W, Wang Y, Bai P, Zhang L, Hayakawa K, Toriba A, Tang N. Exposure to Atmospheric Particulate Matter-Bound Polycyclic Aromatic Hydrocarbons and Their Health Effects: A Review. Int J Environ Res Public Health. 2021 Feb 23;18(4):2177
Young et al (1976). Young AL, Thalken CE, Arnold EL, Cupello JM, Cockerham LG (1976). Fate of 2,3,7,8-tetrachlorodibenzo-p-dioxin (TCDD) in the Environment: Summary and Decontamination Recommendations (Technical report). United States Air Force Academy. TR 76 18.
Yu P et al, (2020). Yu P, Xu R, Abramson MJ, Li S, Guo Y. Bushfires in Australia: a serious health emergency under climate change. Lancet Planet Health. 2020 Jan;4(1):e7-e8. doi: 10.1016/S2542-5196(19)30267-0. Epub 2020 Jan
Zhao et al (2000). Zhao, ZB., Liu, K., Xie, W. et al. (2000). Soluble polycyclic aromatic hydrocarbons in raw coals. J. Hazard. Mater. 73, 77-85.
